
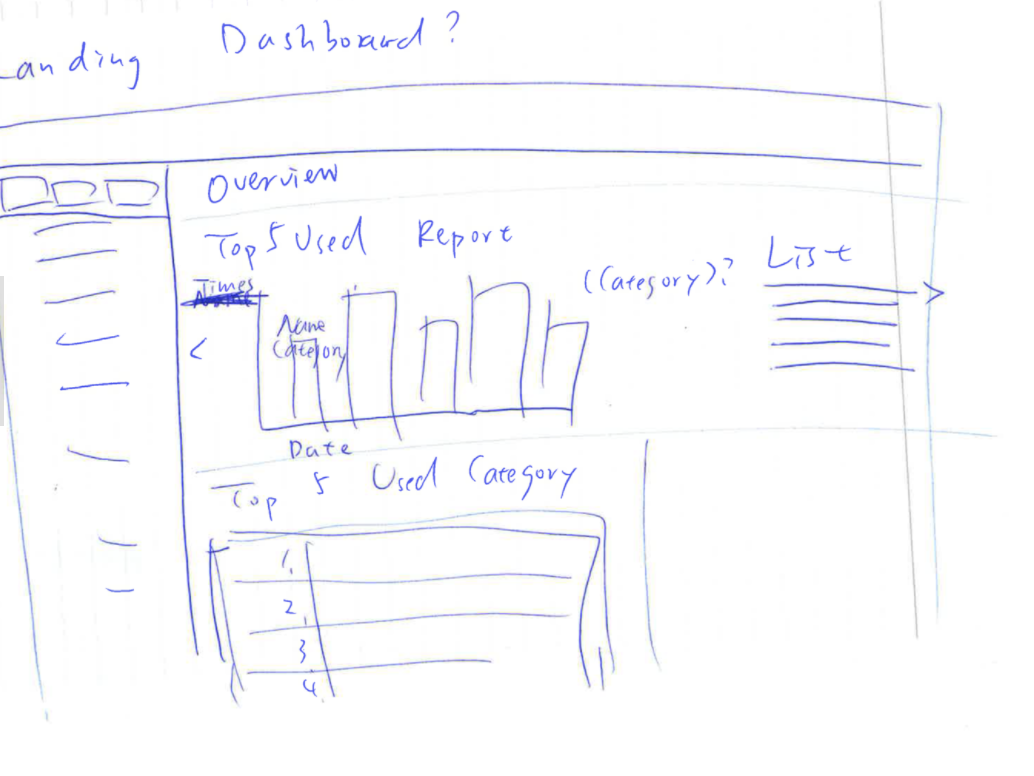
Overview
StrataCloud strived to help IT teams modernize and streamline the data center. Some of my major task was (A) to design a reporting tool to allow end users to customize chart reports and automate reporting schedules (B) to clean up VMC dashboard view to accommodate smaller virtual machine vendors.


Role: UX Engineer
User Goal

Dashboard View
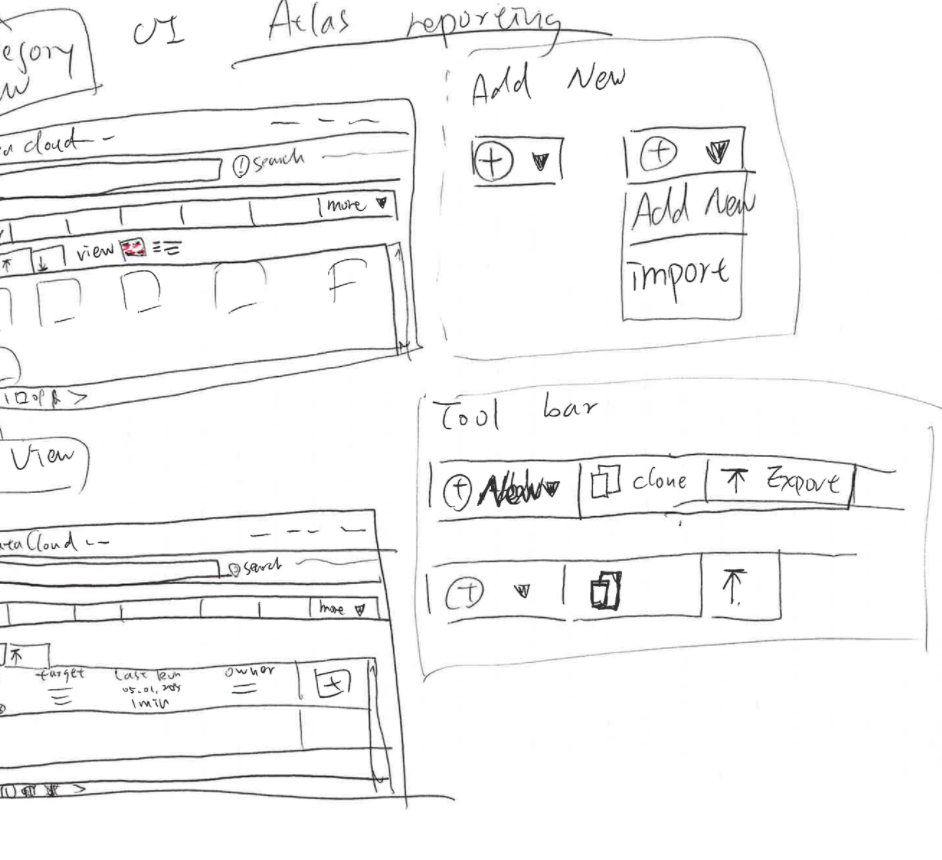
Enable scheduling and oversee granular report history

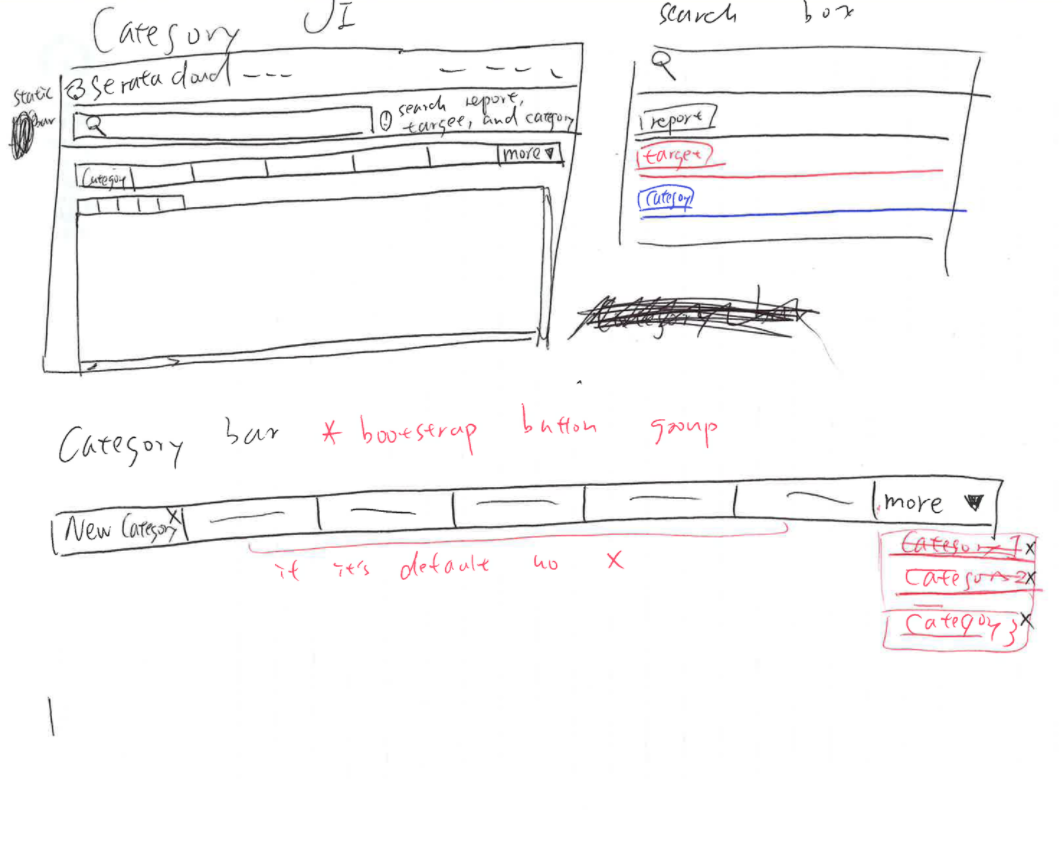
Easy access to report database
To search and find long list of available reports easily

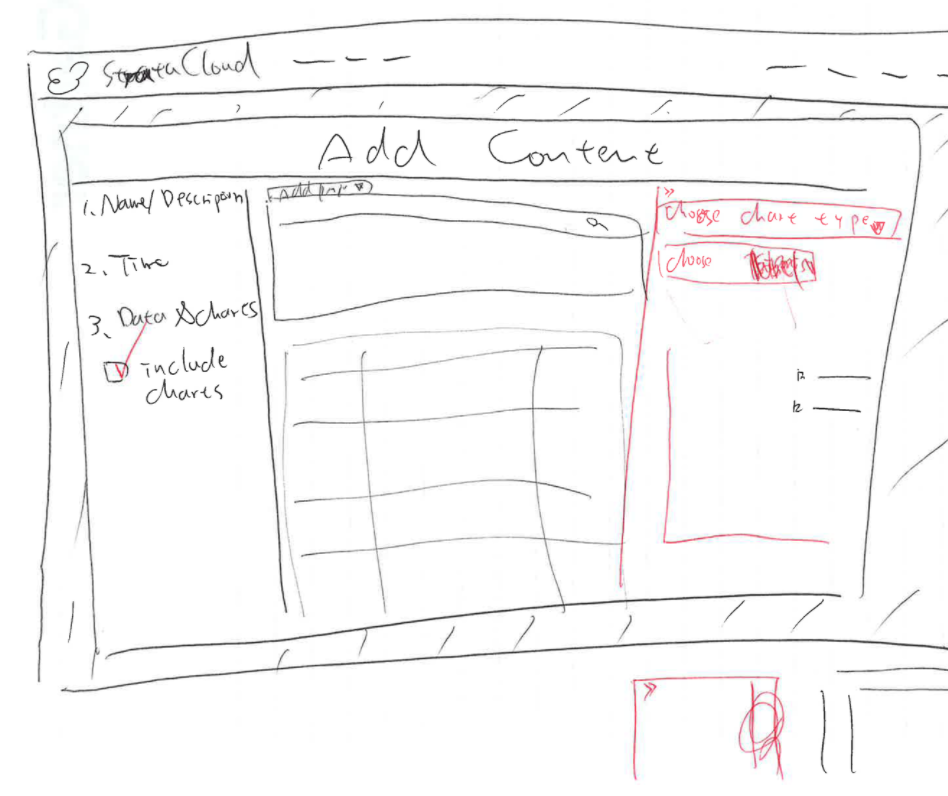
Add and configurate charts freely
To create a report with desired charts by customizing configurations
Sketching ideas
Interactive Wireframe
Hi-fidelity UI

Original Dashboard
was targeted with large scale VM vendors, smaller vendors find most information hard to read and not really using all the information being displayed

New Dashboard
focused on three major areas: capacity, usage, and rightsize. Users can now easily troubleshoot based on the historical measure of data.